

I encourage people who are subscribed to my email list to send me suggestions for tutorials they would like to see, and one of the most frequent requests I receive is a for a tutorial on how to add charts to an Ionic application. Adding charts to applications is certainly no new problem – many libraries exist to handle creating them, so there’s no need for us to reinvent the wheel. With so many options available, however, we need to choose a library that is going to work well within an Ionic/Angular ecosystem.
Chart.js makes it insanely easy to add charts to your Ionic applications. It’s a Javascript library that uses the HTML5 <canvas> element to display graphs, which is perfect for an HTML5 mobile application. The charts are super simple to set up, they look beautiful, and they are responsive by default – so they easily scale with your application as you change between devices or screen orientation.
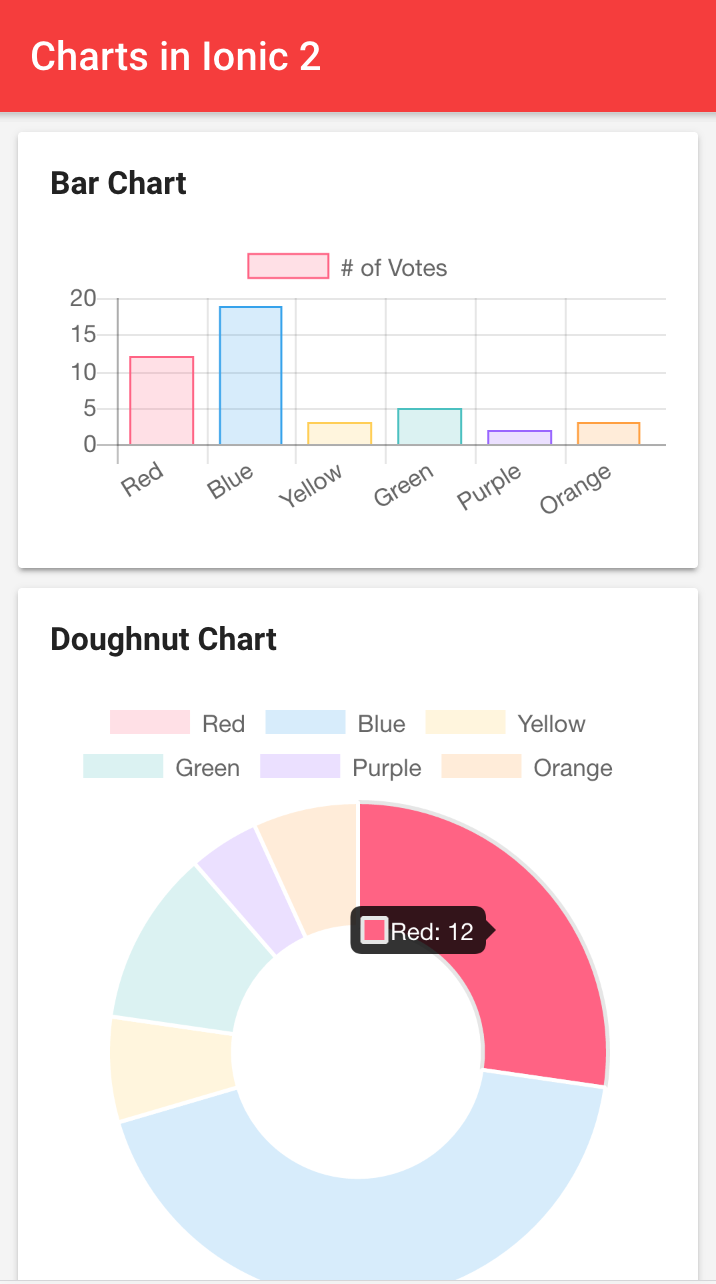
This is going to be a very quick tutorial that will run through setting up Chart.js in an Ionic/Angular application and creating a few different types of graphs. Here’s what it will look like when we’re done:
Before We Get Started
Last updated for Ionic 4.1.0
Before you go through this tutorial, you should have at least a basic understanding of Ionic/Angular.
If you’re not familiar with Ionic already, I’d recommend reading my beginner Ionic tutorials first to get up and running and understand the basic concepts. If you want a much more detailed guide for learning Ionic/Angular, then take a look at Building Mobile Apps with Ionic & Angular.
1. Install Chart.js
I will assume that you already have an Ionic project created that you want to set up charts in - we will be walking through an example of adding charts to the “home” page, but you can add the charts wherever you like.
To begin, we are going to install the Chart.js library using npm. Just run the following command:
npm install chart.js --saveNow you can use Chart.js anywhere you like in your project by importing it like this:
import { Chart } from 'chart.js';2. Set up the Template
As I mentioned before, Chart.js uses an HTML5 canvas element to display the charts, so we will need to set that up in our template first.
Modify src/pages/home/home.html to reflect the following:
<ion-header>
  <ion-toolbar>
    <ion-title> Charts </ion-title>
  </ion-toolbar>
</ion-header>

<ion-content>
  <div class="ion-padding">
    <ion-card>
      <ion-card-header> Bar Chart </ion-card-header>
      <ion-card-content>
        <canvas #barCanvas></canvas>
      </ion-card-content>
    </ion-card>

    <ion-card>
      <ion-card-header> Doughnut Chart </ion-card-header>
      <ion-card-content>
        <canvas #doughnutCanvas></canvas>
      </ion-card-content>
    </ion-card>

    <ion-card>
      <ion-card-header> Line Chart </ion-card-header>
      <ion-card-content>
        <canvas #lineCanvas></canvas>
      </ion-card-content>
    </ion-card>
  </div>
</ion-content>
This is a pretty standard card layout, and we are using three cards to store three different charts. In each of these cards, we have a <canvas> element, and we add a local variable like #barCanvas so that we can easily grab a reference to it from our TypeScript file (which we will do very shortly).
3. Create the Graphs
Now, all we need to do is generate the graphs. I’m going to use some sample code from the documentation to set up three graph examples, if you would like to know what other options are available you can take a look at the documentation.
Let’s start off by just creating the bar chart.
Modify src/pages/home/home.ts to reflect the following:
import { Component, OnInit, ViewChild, ElementRef } from "@angular/core";
import { Chart } from "chart.js";

@Component({
  selector: "app-home",
  templateUrl: "home.page.html",
  styleUrls: ["home.page.scss"]
})
export class HomePage implements OnInit {
  @ViewChild("barCanvas") barCanvas: ElementRef;

  private barChart: Chart;

  constructor() {}

  ngOnInit() {
    this.barChart = new Chart(this.barCanvas.nativeElement, {
      type: "bar",
      data: {
        labels: ["Red", "Blue", "Yellow", "Green", "Purple", "Orange"],
        datasets: [
          {
            label: "# of Votes",
            data: [12, 19, 3, 5, 2, 3],
            backgroundColor: [
              "rgba(255, 99, 132, 0.2)",
              "rgba(54, 162, 235, 0.2)",
              "rgba(255, 206, 86, 0.2)",
              "rgba(75, 192, 192, 0.2)",
              "rgba(153, 102, 255, 0.2)",
              "rgba(255, 159, 64, 0.2)"
            ],
            borderColor: [
              "rgba(255,99,132,1)",
              "rgba(54, 162, 235, 1)",
              "rgba(255, 206, 86, 1)",
              "rgba(75, 192, 192, 1)",
              "rgba(153, 102, 255, 1)",
              "rgba(255, 159, 64, 1)"
            ],
            borderWidth: 1
          }
        ]
      },
      options: {
        scales: {
          yAxes: [
            {
              ticks: {
                beginAtZero: true
              }
            }
          ]
        }
      }
    });
  }
}
Notice that we are importing Chart, and we are also importing ViewChild. We use ViewChild to grab a reference to the local variable we attached to the canvas in the template, and then we supply that element to new Chart when we are creating a chart. All we have to do is supply Chart with an object that defines the type of chart we want, and the type of data we want to display.
If you are not familiar with the usage of @ViewChild you might want to watch: @ViewChildren vs @ContentChildren.
The bar chart should be displayed in your application now. Let’s finish it up by adding two more examples.
Modify src/pages/home/home.ts to reflect the following:
import { Component, OnInit, ViewChild, ElementRef } from "@angular/core";
import { Chart } from "chart.js";

@Component({
  selector: "app-home",
  templateUrl: "home.page.html",
  styleUrls: ["home.page.scss"]
})
export class HomePage implements OnInit {
  @ViewChild("barCanvas") barCanvas: ElementRef;
  @ViewChild("doughnutCanvas") doughnutCanvas: ElementRef;
  @ViewChild("lineCanvas") lineCanvas: ElementRef;

  private barChart: Chart;
  private doughnutChart: Chart;
  private lineChart: Chart;

  constructor() {}

  ngOnInit() {
    this.barChart = new Chart(this.barCanvas.nativeElement, {
      type: "bar",
      data: {
        labels: ["Red", "Blue", "Yellow", "Green", "Purple", "Orange"],
        datasets: [
          {
            label: "# of Votes",
            data: [12, 19, 3, 5, 2, 3],
            backgroundColor: [
              "rgba(255, 99, 132, 0.2)",
              "rgba(54, 162, 235, 0.2)",
              "rgba(255, 206, 86, 0.2)",
              "rgba(75, 192, 192, 0.2)",
              "rgba(153, 102, 255, 0.2)",
              "rgba(255, 159, 64, 0.2)"
            ],
            borderColor: [
              "rgba(255,99,132,1)",
              "rgba(54, 162, 235, 1)",
              "rgba(255, 206, 86, 1)",
              "rgba(75, 192, 192, 1)",
              "rgba(153, 102, 255, 1)",
              "rgba(255, 159, 64, 1)"
            ],
            borderWidth: 1
          }
        ]
      },
      options: {
        scales: {
          yAxes: [
            {
              ticks: {
                beginAtZero: true
              }
            }
          ]
        }
      }
    });

    this.doughnutChart = new Chart(this.doughnutCanvas.nativeElement, {
      type: "doughnut",
      data: {
        labels: ["Red", "Blue", "Yellow", "Green", "Purple", "Orange"],
        datasets: [
          {
            label: "# of Votes",
            data: [12, 19, 3, 5, 2, 3],
            backgroundColor: [
              "rgba(255, 99, 132, 0.2)",
              "rgba(54, 162, 235, 0.2)",
              "rgba(255, 206, 86, 0.2)",
              "rgba(75, 192, 192, 0.2)",
              "rgba(153, 102, 255, 0.2)",
              "rgba(255, 159, 64, 0.2)"
            ],
            hoverBackgroundColor: ["#FF6384", "#36A2EB", "#FFCE56", "#FF6384", "#36A2EB", "#FFCE56"]
          }
        ]
      }
    });

    this.lineChart = new Chart(this.lineCanvas.nativeElement, {
      type: "line",
      data: {
        labels: ["January", "February", "March", "April", "May", "June", "July"],
        datasets: [
          {
            label: "My First dataset",
            fill: false,
            lineTension: 0.1,
            backgroundColor: "rgba(75,192,192,0.4)",
            borderColor: "rgba(75,192,192,1)",
            borderCapStyle: "butt",
            borderDash: [],
            borderDashOffset: 0.0,
            borderJoinStyle: "miter",
            pointBorderColor: "rgba(75,192,192,1)",
            pointBackgroundColor: "#fff",
            pointBorderWidth: 1,
            pointHoverRadius: 5,
            pointHoverBackgroundColor: "rgba(75,192,192,1)",
            pointHoverBorderColor: "rgba(220,220,220,1)",
            pointHoverBorderWidth: 2,
            pointRadius: 1,
            pointHitRadius: 10,
            data: [65, 59, 80, 81, 56, 55, 40],
            spanGaps: false
          }
        ]
      }
    });
  }
}
Now we have added a doughnut chart and a line chart. These both use exactly the same method as we used for the bar chart, except that we supply a different configuration in the object that we supply.
Summary
Getting charts set up in your Ionic applications with Chart.js only takes a matter of minutes, but it is also an in-depth library with plenty of advanced customisations. So, if you’re just looking to display a simple chart, or you want to do something more advanced, Chart.js should be a good option in many situations.